Data Visualization Using Pyplot || Sumita Arora || Class 12 || Computer science || Information practices || Solution ||
TYPE C --
Q 1 = consider the data given below create a sequence required from the data below :-
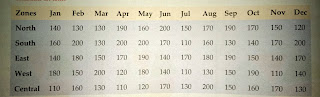
write code to :
(a)create bar chart to see distribution of rainfall from jan – dec for all the zones .
(b)create a pie chart to check the amount of rainfall in jan separately .
(c)create a line chart to observe any trends from jan to dec .
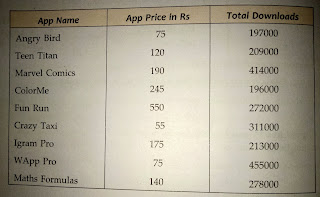
Q 2 = consider the data given below :
upload type A answers
ReplyDeleteThis chapter has deleted from our syllabus . : )
DeleteTHE SYLLABUS IS BACK THO :(
ReplyDeleteNo, according to new syllabus it is out of syllabus in CS.
Deletebut in IP it is present.
Post a Comment
You can help us by Clicking on ads. ^_^
Please do not send spam comment : )